VolumeSense
Real-time volume action charts with Interactive Brokers
About
VolumeSense is a charting application for Interactive Brokers focused on volume and volume action. It creates intuitive charts displaying the volume traded at the bid versus the volume traded at the ask for any traded price. VolumeSense works on Windows, Mac and Linux.
Screenshot
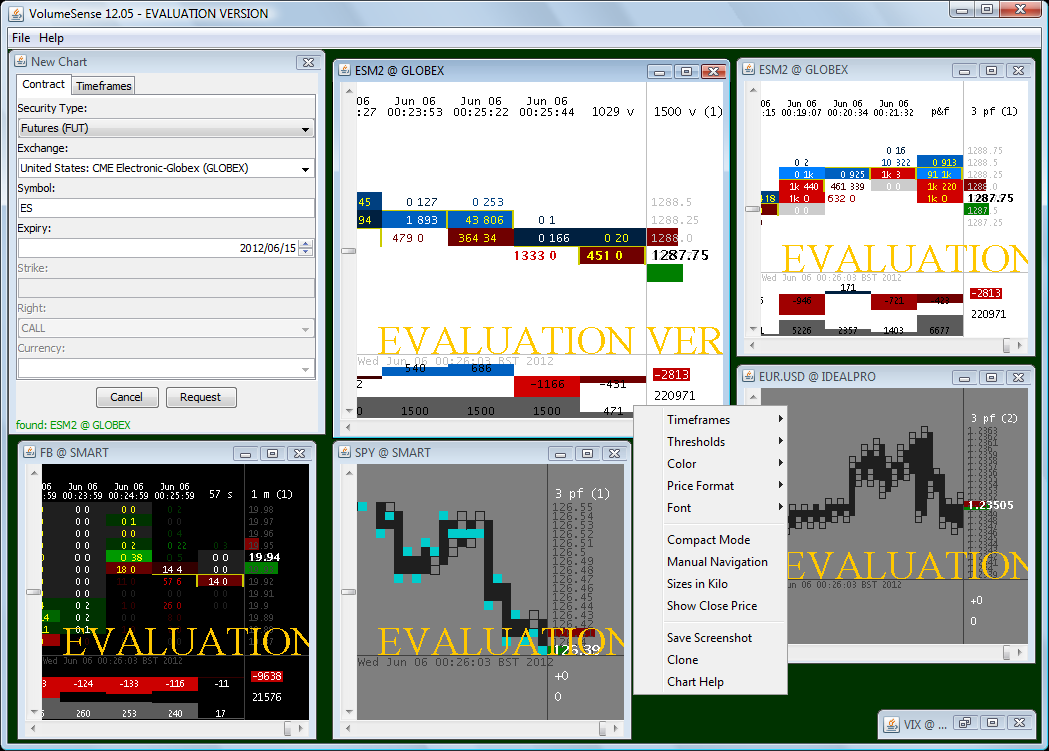
The screenshot (click it to enlarge) shows charts with cells indicating the number of contracts traded at the bid (left number) and contracts traded at the ask (right number). Blue cells (or green - function of the selected color scheme) indicate a positive volume balance (more contracts bought at the ask than sold at the bid) while red cells indicate a negative volume balance (more contracts sold at the bid than bought at the ask). Darker colored cells indicate equilibrium while brighter colored cells indicate higher volume unbalance. At the bottom of the charts are displayed the volume balance histogram and the total volume histogram. In the screenshot both gray charts are set to compact mode. A more detailed explanation of all charting features is provided in the documentation.
Features
- Block-style charts with intuitive display of volume traded at the bid and ask
- Supported charting types: time-based, volume-based, trades, point & figure and price range
- Real-time chart updates (note: historical data/back-fill is not available)
- Price compression functionality (each cell can consolidate many price levels)
- Volume balance and volume histograms
- Total volume balance and total volume counters
- Indication of cells with the highest traded volume
- Compact charting mode
- Configurable color thresholds
- Different color schemes available
- Screenshot functionality
- Data export functionality
- Several favorite symbols listed
- Detailed documentation (charting guide)
Requests
Click to Buy
Free 7-day Evaluation
Forward this page to someone.
Questions ? Use the Contact form.

Interactive Brokers (IB) is a low cost provider of trade execution and clearing services for individuals, advisors, prop trading groups, brokers and hedge funds. IB's premier technology provides direct access to stocks, options, futures, forex, bonds and funds on over 100 markets worldwide from a single IB Universal account.
Member NYSE, FINRA, SIPC. Visit www.interactivebrokers.com for more information.
Copyright © 2009-2026 Trading Software Lab. All rights reserved.